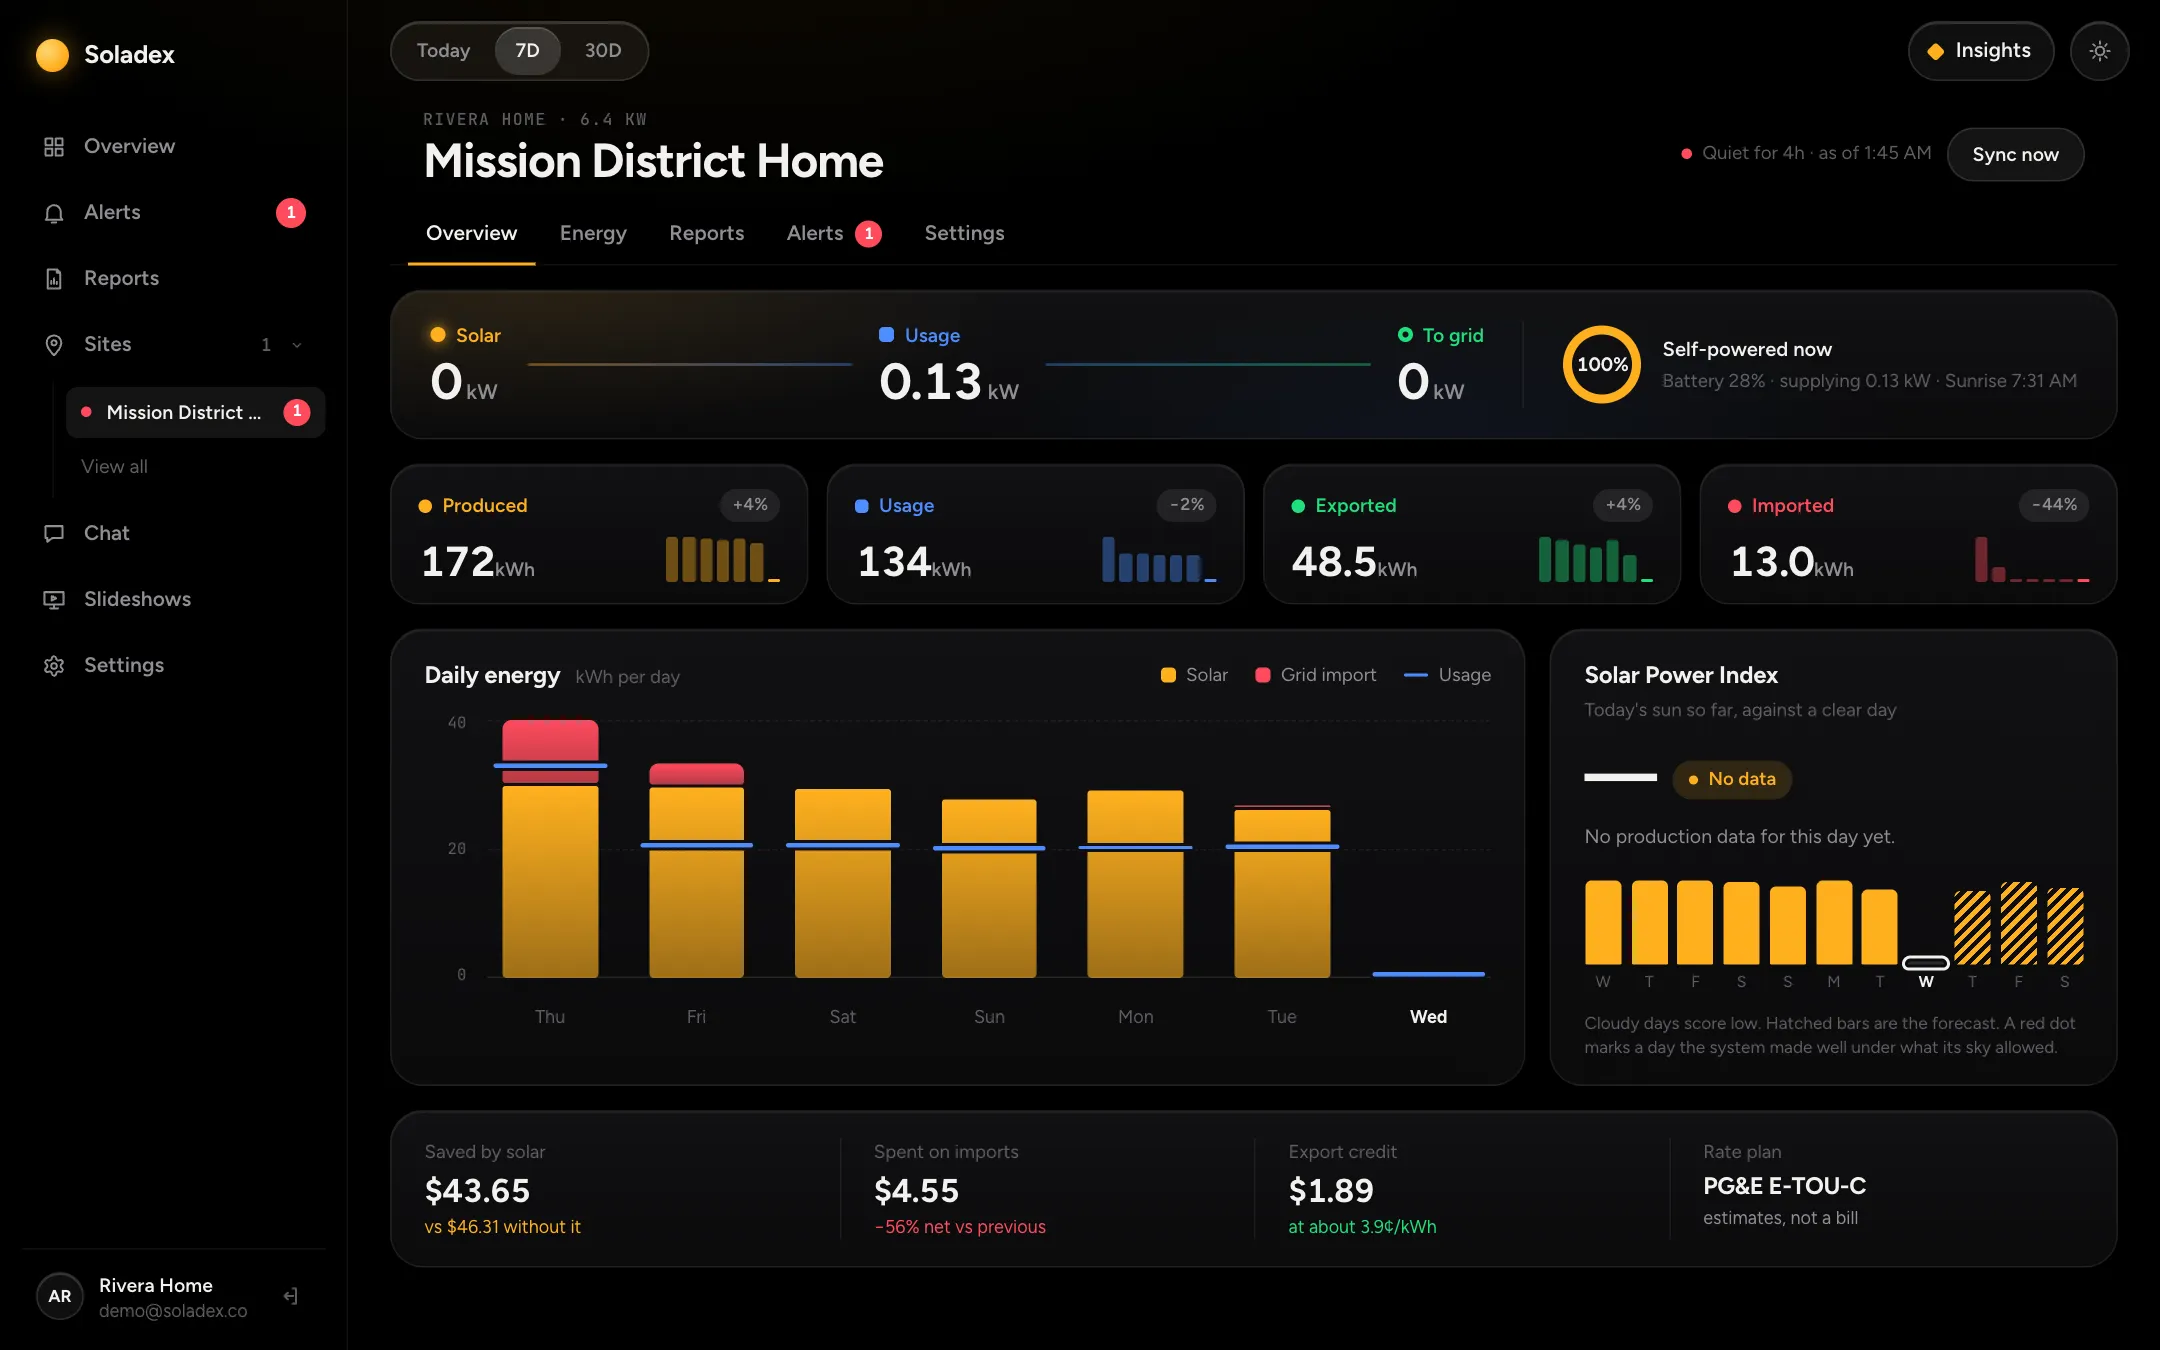
Web
Every site, every page, in any browser.
Product
Energy flow, history you can read, an AI that explains it, and alerts that catch problems early. On every screen you own.
Energy flow
Roof to home to grid. See at a glance whether you ran on sun, stored it or sold it.
Solar
4.21kW
Home
3.08kW
Grid
1.13kW
Energy
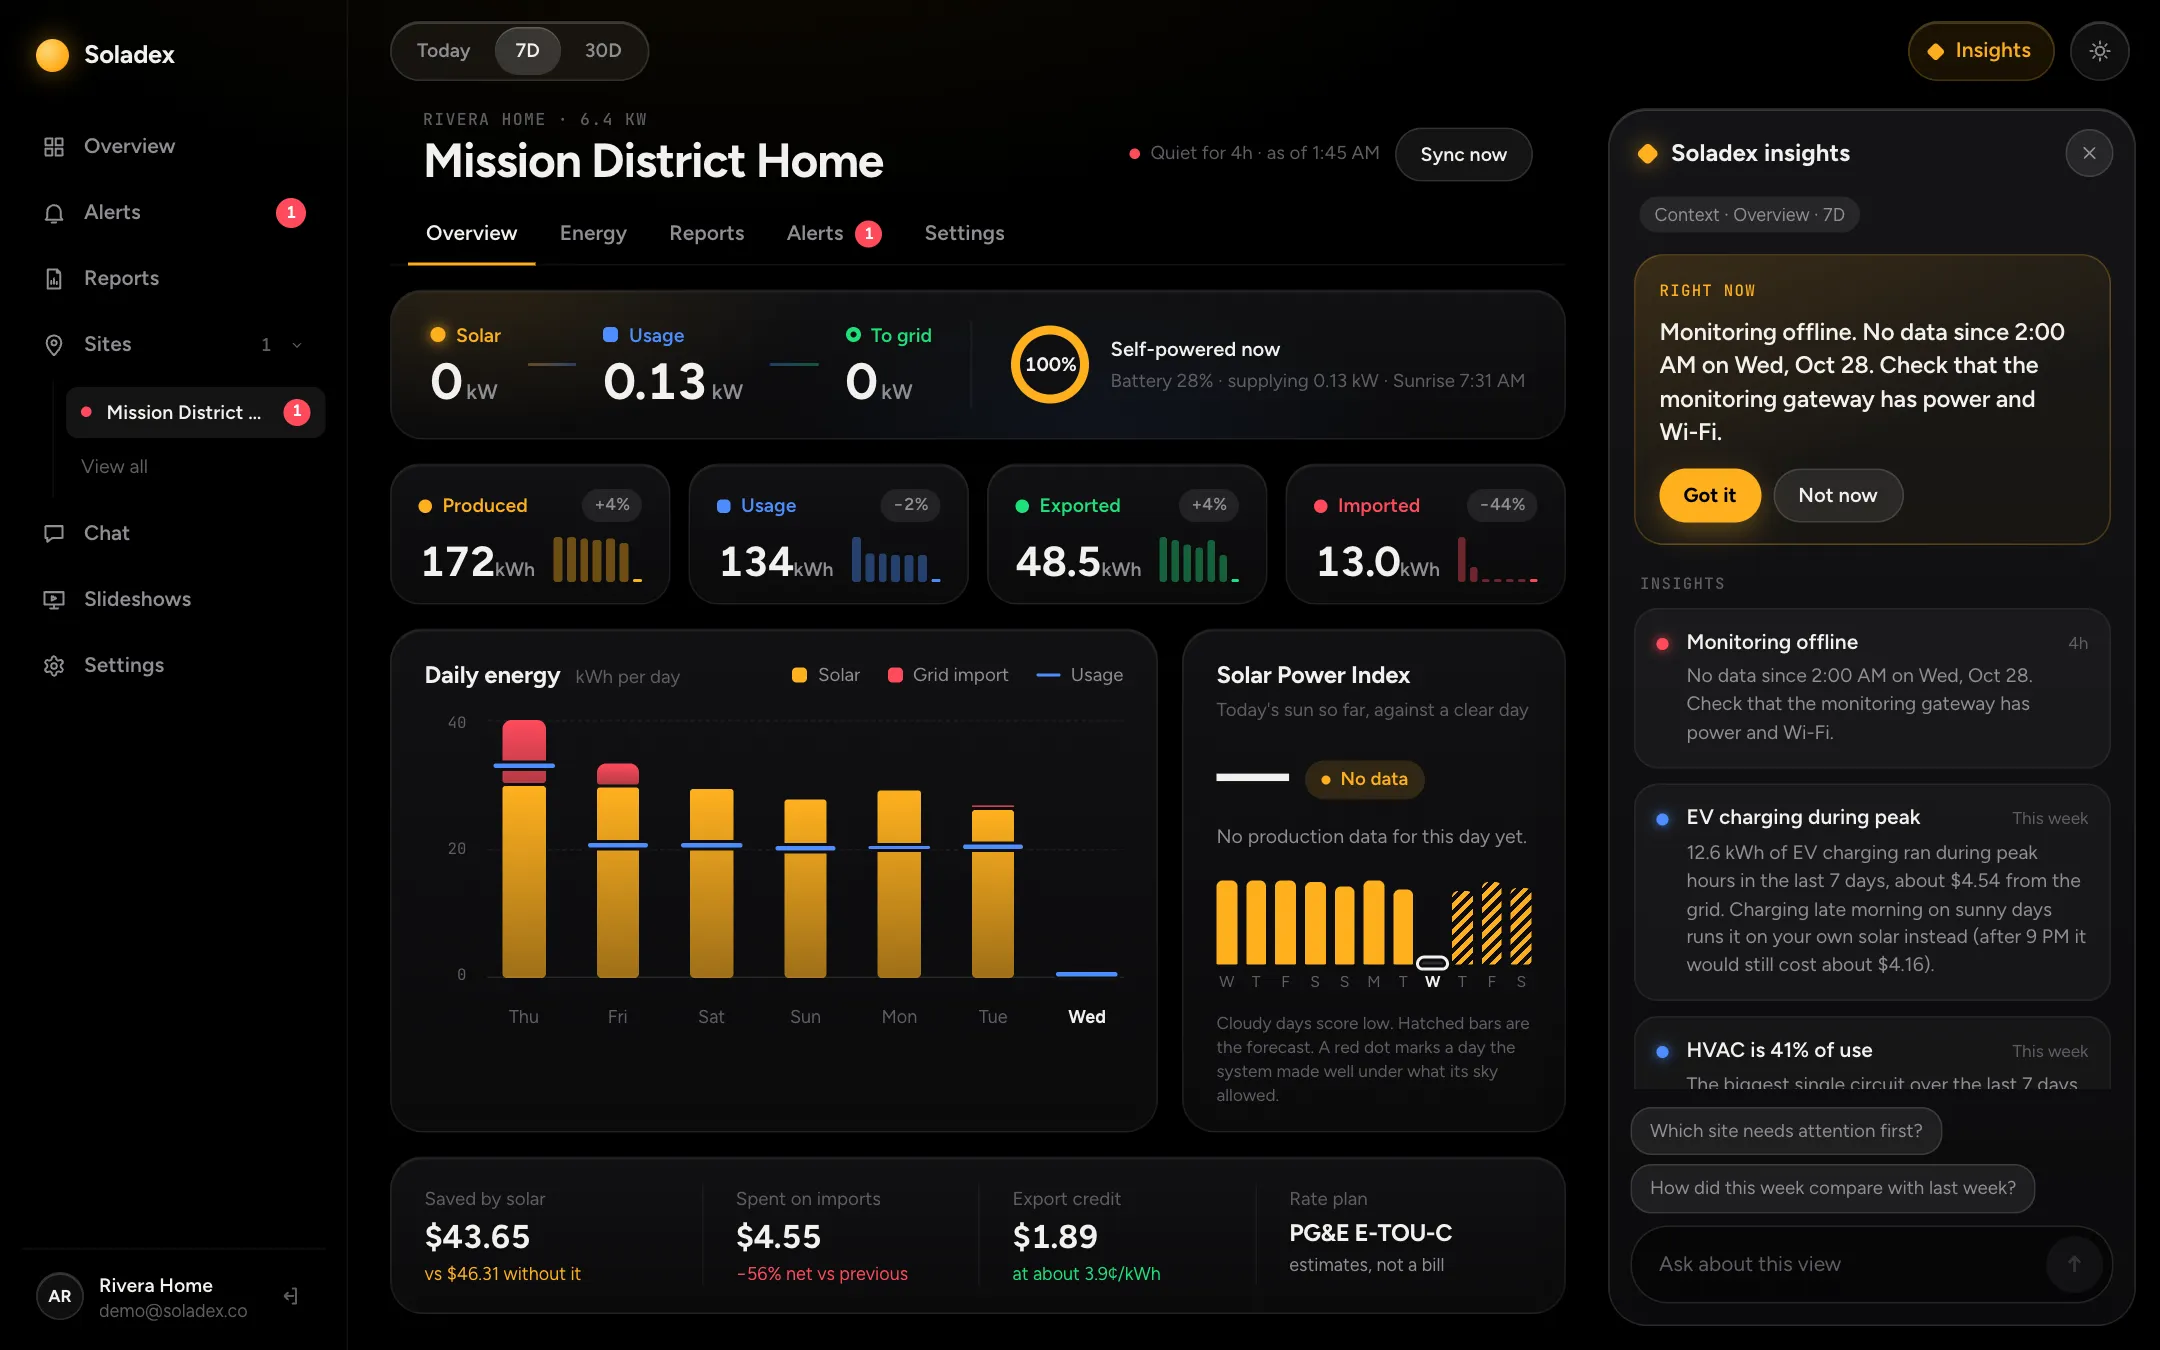
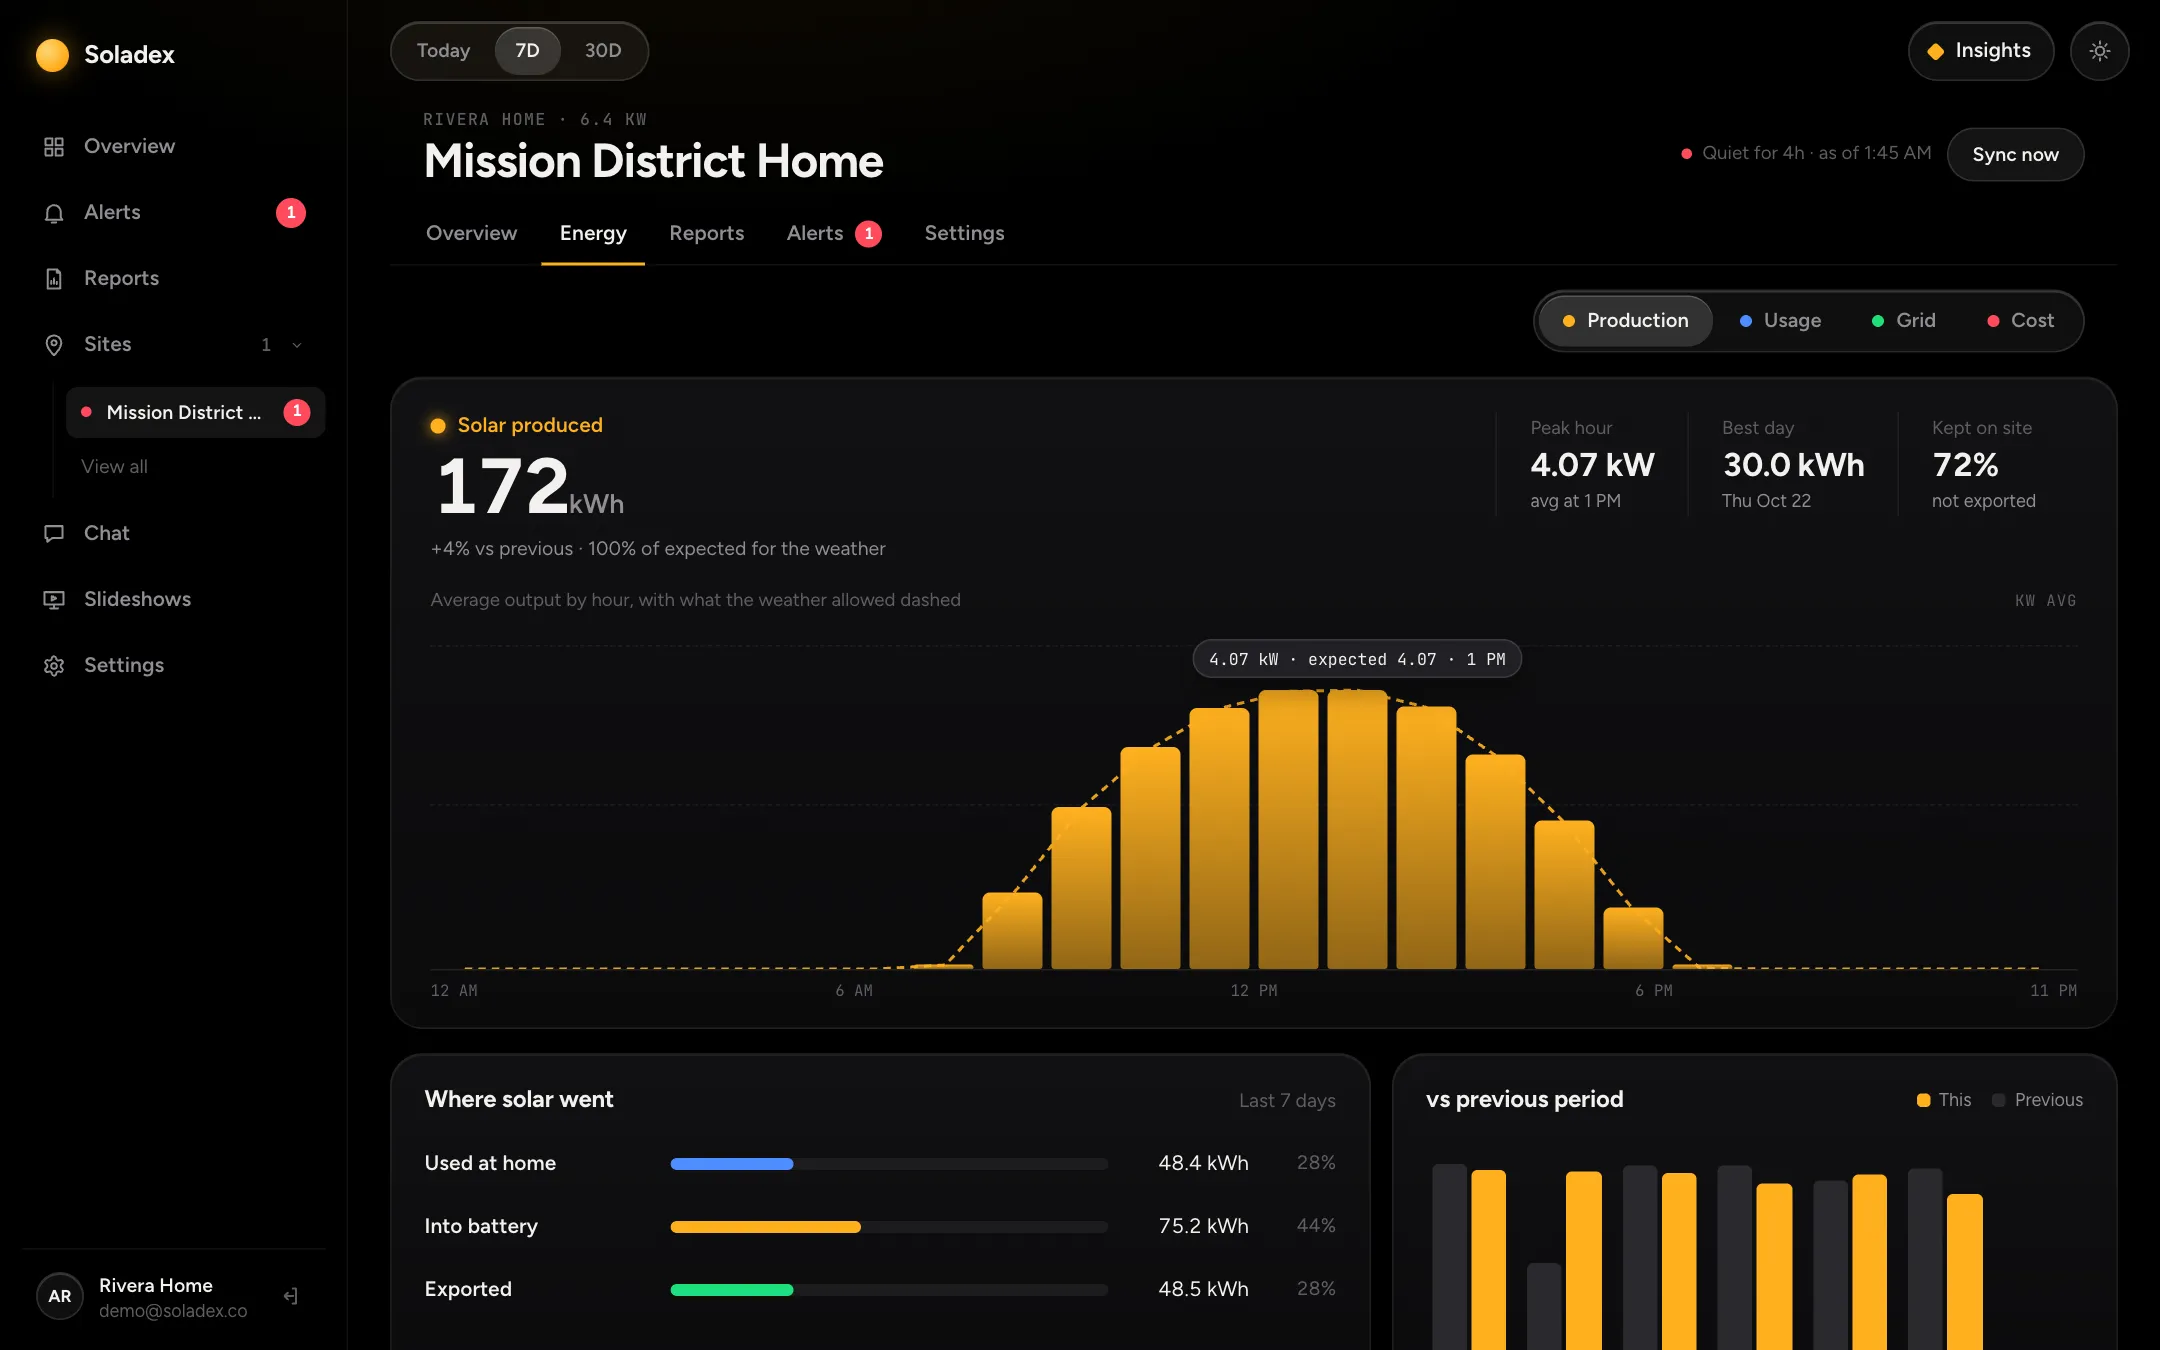
Production, home use, grid and cost, each on its own tab. Every hour, every day, every year, with the last period one tap away.
Soladex AI
Soladex AI reads your production, usage, rates and the weather. It stays docked beside every screen and knows what you’re looking at.
Right now
One timely suggestion, from the forecast and your tariff.
Insights
What changed this week, and why.
Ask
Plain-language questions, real numbers back.
Context-aware
Follows the page and period you’re on.
Soladex AIOverview · 7D
Why was my bill higher this week?
EV charging ran during peak hours: 12.6 kWh from the grid. Charging late morning on sunny days runs it on your own solar instead.
Ask a follow-up…↑
An example answer from the demo
Alerts
Fixed rules checked after every sync, not guesses. Clouds can’t trigger them: they watch for missing data, output stopping in full sun, and use far above normal. When something’s off, the right people get one email.
Monitoring offline
No data for 3 hours: check the gateway’s power and Wi-Fi
Production stopped
No solar for an hour while the sky expects strong sun
Unusual use
Far above normal for this time of day
Resolved: back online
Mission District Home · 4.5 h without data
Screens
The same four colors and the same answers everywhere. Slideshows turn a lobby TV, an iPad or a kiosk into a wall display, readable from across the room.
Every site, every page, in any browser.
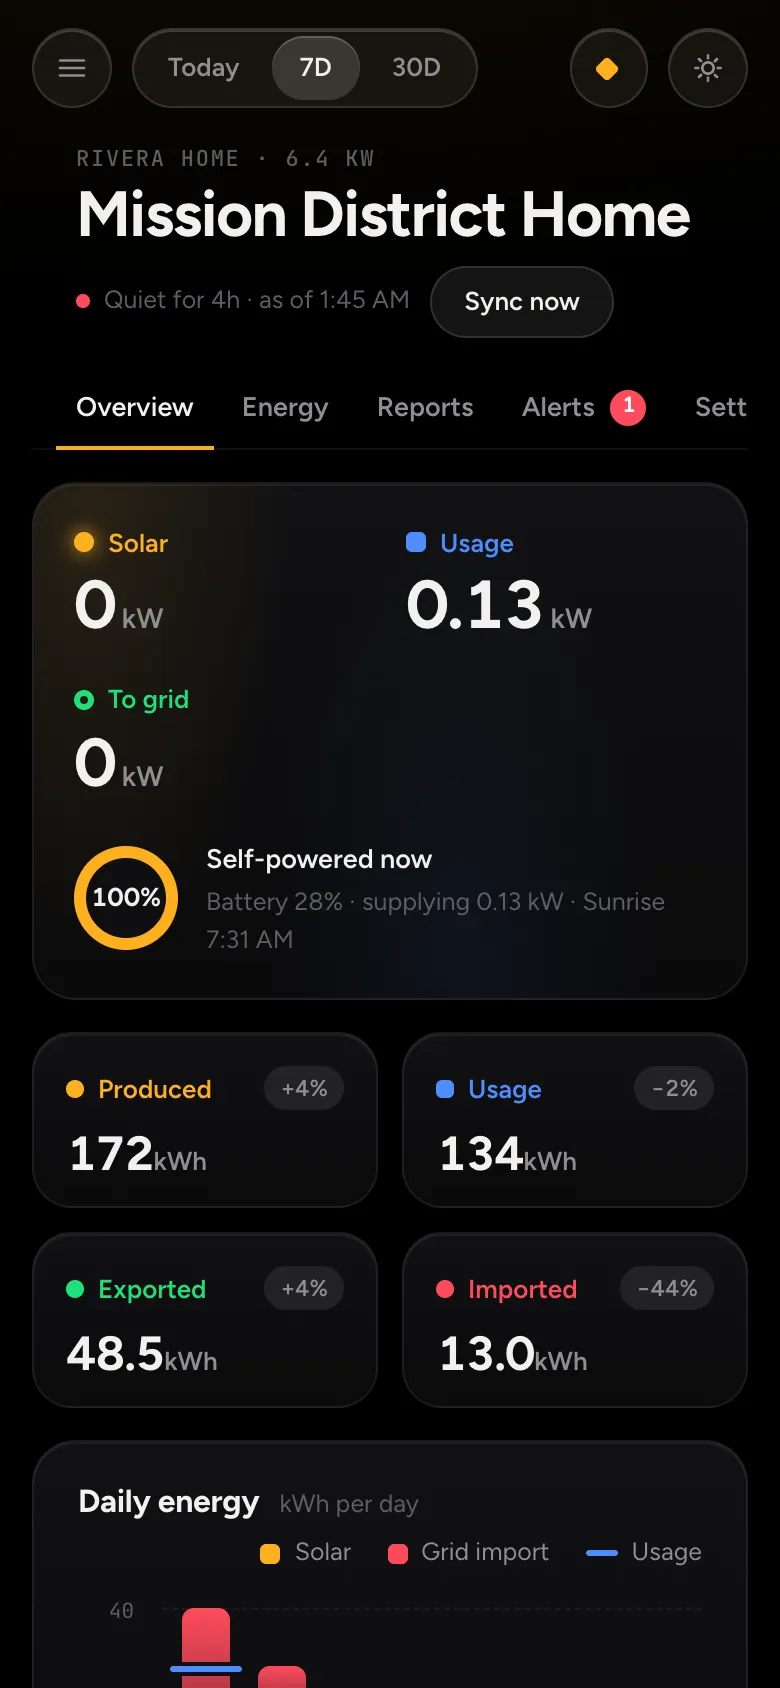
The same dashboard, laid out for your phone. Native apps are on the way.
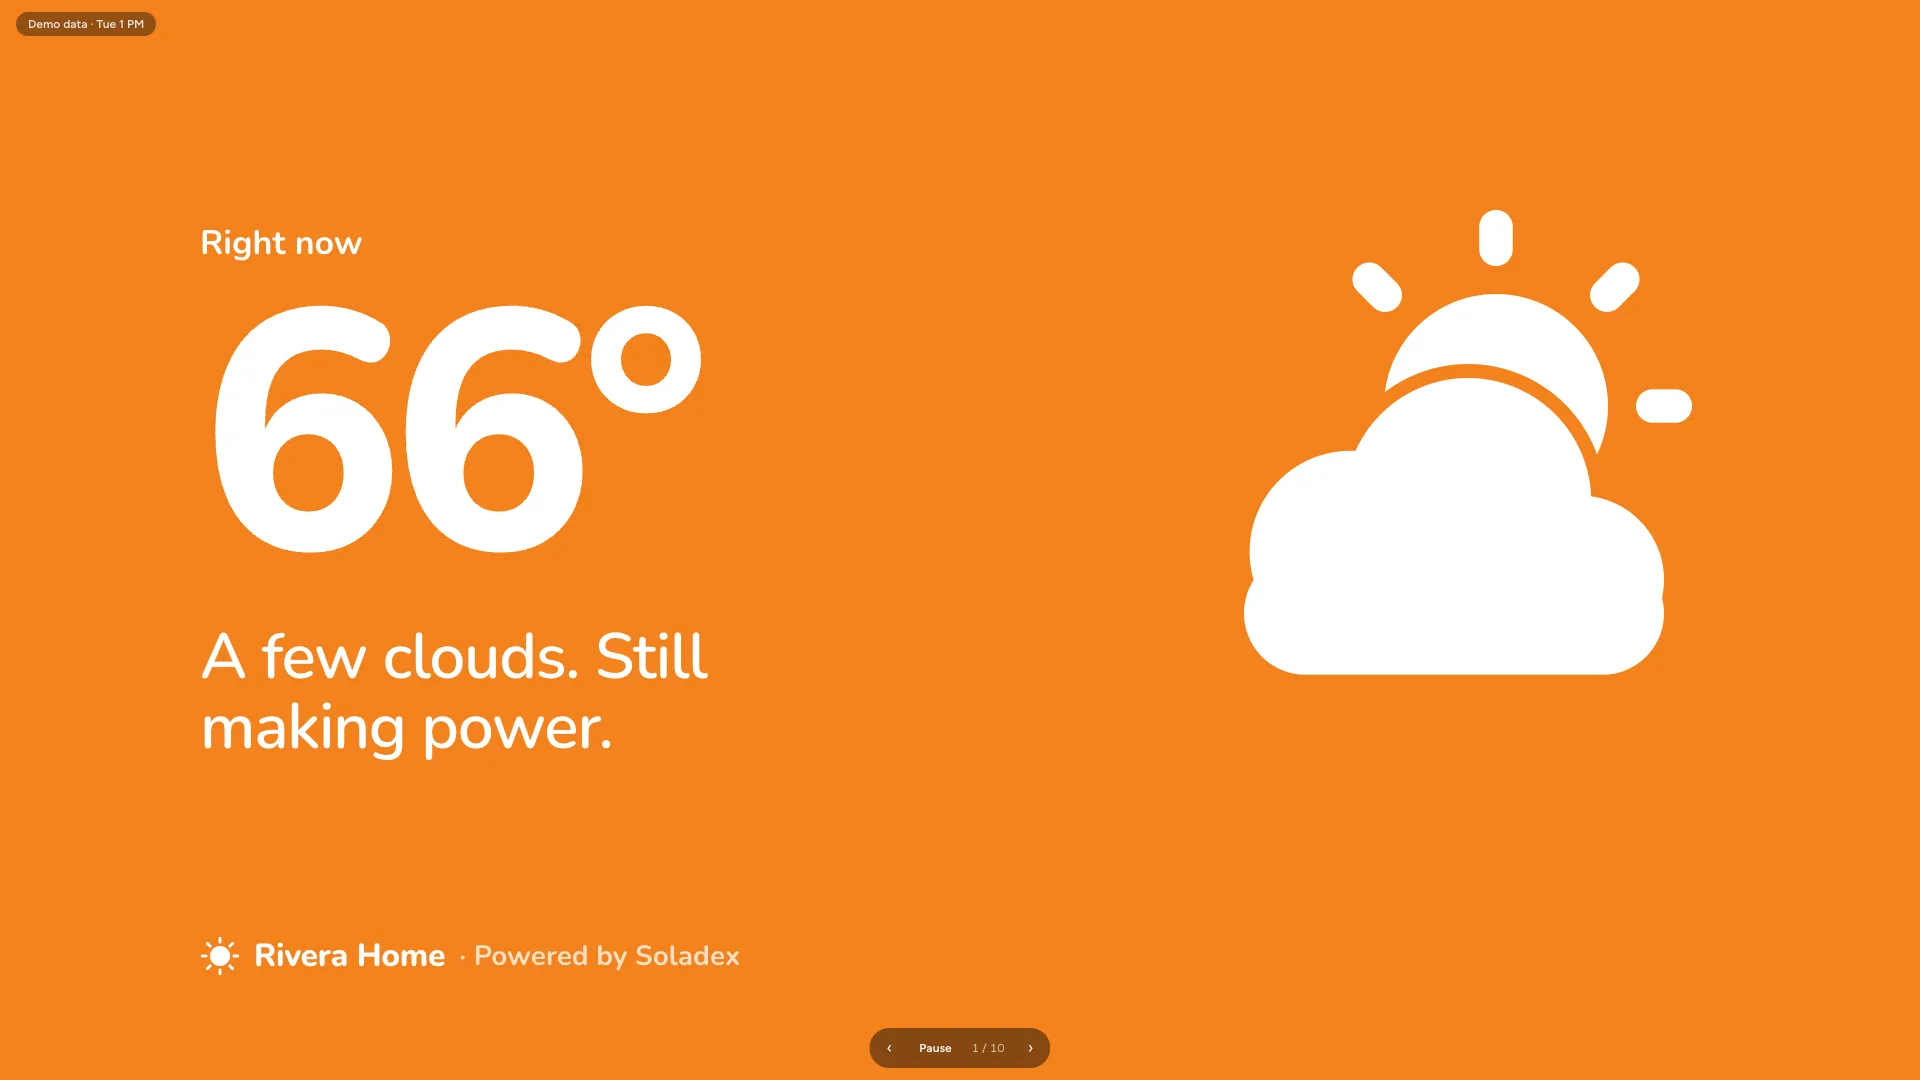
Slideshows for TVs, iPads and kiosks, with a QR code to follow along.